Evolution of Colors - II
Hello, it's been a while since my previous blog. Today I want to continue and take forward the project I started in the previous one. From the graphs that I posted at the end of the blog, we see that the colors are not evolving smoothly. While we run the simulation, we see that the colors are changing although, we want smooth transitions between each color. In simple words, we want to smooth-en the graph. Well this can be done with Machine Learning! How?
We will use Regression, Polynomial Regression. In simple words, polynomial regression means, that we will find a curve that will best fit our data. This is helpful in making predictions, although we will use it to smooth-en the curve.
There is just one thing that you must know. The code below is probably not the
best implementation of polynomial regression. We will first create a graph of
our colors and then find the model. After this we will find the values from
the graph and make those our color values.
The Formalities
We will write the code from zero, not continue our previous code. First import the libraries.
import pyglet as pt
import random as r
import matplotlib.pyplot as plt
import numpy as np
Now we will create our window, define our batch and background color.
window = pt.window.Window(500, 500, "Evolving Colors", True)
window.set_fullscreen(True)
batch = pt.graphics.Batch()

background = pt.shapes.Rectangle(0, 0, window.width, window.height, batch=batch)
Now declare our variables
colorsTuple = (r.randint(0, 255), r.randint(0, 255), r.randint(0, 255))
colors = list(colorsTuple)
background.color = colorsTuple

red = []
green = []
blue = []
improved = [[], [], []]
colorVals = [red, green, blue]

index = 10
timeFactor = 60
loopIndex = 5000
We will use the same technique from the previous blog, of converting the tuple
into a list, working with that and then converting that to a tuple.
timeFactor will help us define the frame rate of
the application. Since we will calculate the colors before hand and then fit
the curve, loopIndex will help us calculate the
colors beforehand. improved will be the colors
that we get after polynomial regression.
Now we shall create an update function where the colors will change regularly.
We shall first of course find the randomly generated colors, using the same
technique as explained in the previous blog.
def update(dt):
    global improved, colors, index
    if len(improved[0]) == 0:
        for j in range(loopIndex):
            for i in range(len(colors)):
                if colors[i] >= (255-index):
                    colors[i] -= r.randint(0, index)
                elif colors[i] <= index:
                    colors[i] += r.randint(0, index)
                else:
                    colors[i] += r.randint((-1 * index), index)
                colorVals[i].append(colors[i])
The Model
Now we shall create the model. First we will plot this on a graph and find the
curve that fits best. Then we shall, retrieve the coordinates of the model and
make that our color values. Numpy has a built in function that will do this
for us.
def update(dt):
    if len(improved[0]) == 0:
    	...
        x = np.linspace(0, len(colorVals[0]), num=len(colorVals[0]))
        improvedRed = np.poly1d(np.polyfit(x, colorVals[0], 3))
        improvedGreen = np.poly1d(np.polyfit(x, colorVals[1], 3))
        improvedBlue = np.poly1d(np.poly1d(np.polyfit(x, colorVals[2], 3)))

        redRaw = plt.plot(x, improvedRed(x), c="red")
        greenRaw = plt.plot(x, improvedGreen(x), c="red")
        blueRaw = plt.plot(x, improvedBlue(x), c="red")

        red = redRaw[0].get_ydata()
        green = greenRaw[0].get_ydata()
        blue = blueRaw[0].get_ydata()

        red = red.tolist()
        green = green.tolist()
        blue = blue.tolist()
        improved = [red, green, blue]
x is a linearly spaced set of integers between a
desired range.
improvedRed, improvedBlue and improveGreen is the
model for each color.
redRaw, blueRaw and greenRaw is the plot for each
of the model, but we will not show these plots.
red, blue and green are the numerical values of
our model. Then we just convert that to a list, since they are a Numpy array.
Now we just make these our background color.
def update(dt):
    ...
    colors = [improved[0][0], improved[1][0], improved[2][0]]
    colorsTuple = tuple(colors)
    background.color = colorsTuple

    improved[0].pop(0)
    improved[1].pop(0)
    improved[2].pop(0)
We make the first value of improved our
colors. Then we just simply convert that to a
tuple and make it our background color. Then we remove the first item of the
improved colors. This is just a simpler way of
making sure that we will be getting the correct values for our background
color. Now we shall do the final formalities.
pt.clock.schedule_interval(update, 1/timeFactor)
@window.event
def on_draw():
    window.clear()
    batch.draw()

pt.app.run()
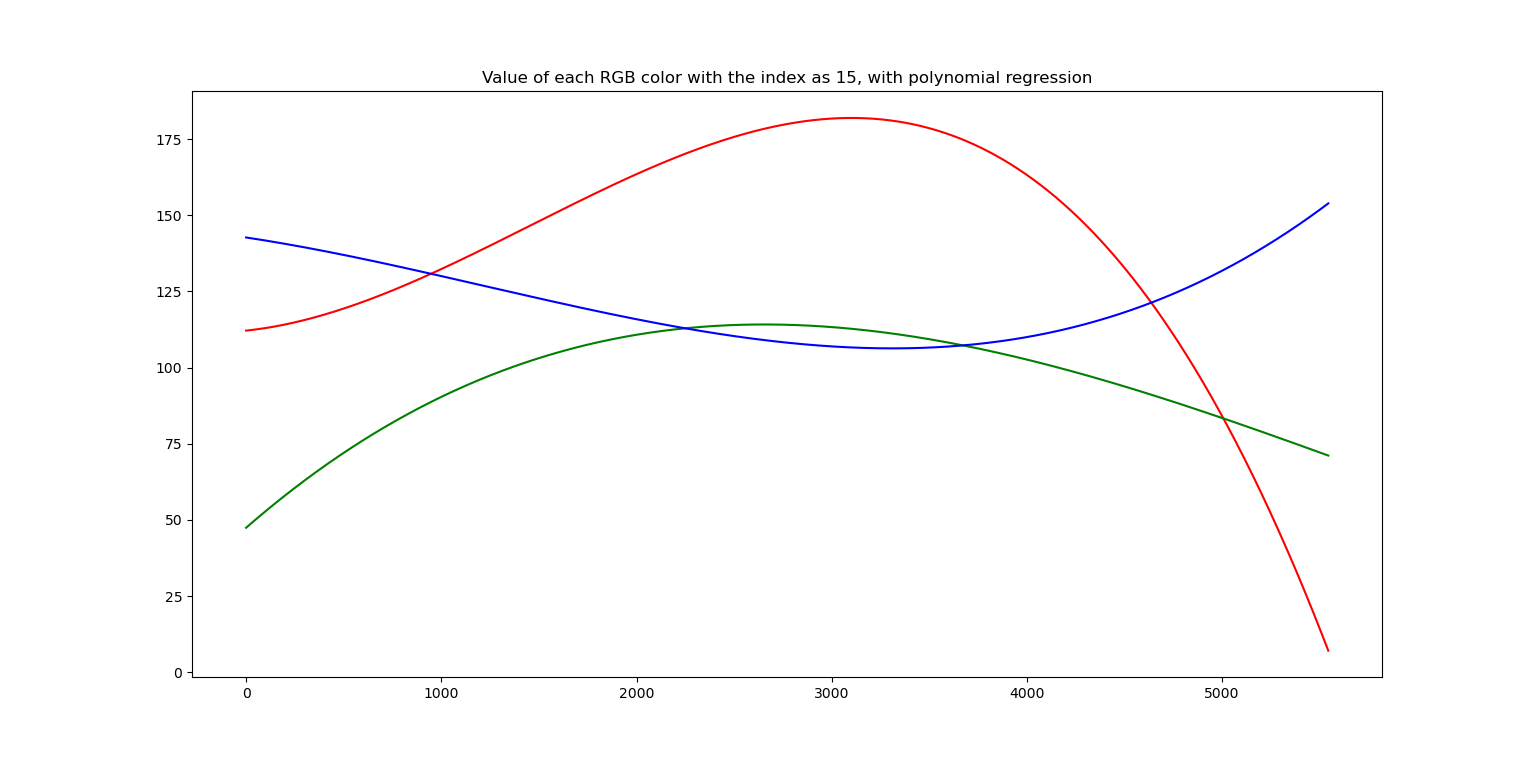
Also now you can use a high mutation rate or index, so the colors do seem do change. Before finishing of this blog, I would like to share some graphs, showing the difference between the before and after polynomial regression.
It seems you have studied the graphs!
Happy evolving!!


Comments